World Market for Wind Power Saw Another Record Year in 2021: 97,3 Gigawatt of New Capacity Added
World Market for Wind Power Saw Another Record Year in 2021: 97,3 Gigawatt of New Capacity Added
Total global capacity reached 840 Gigawatt
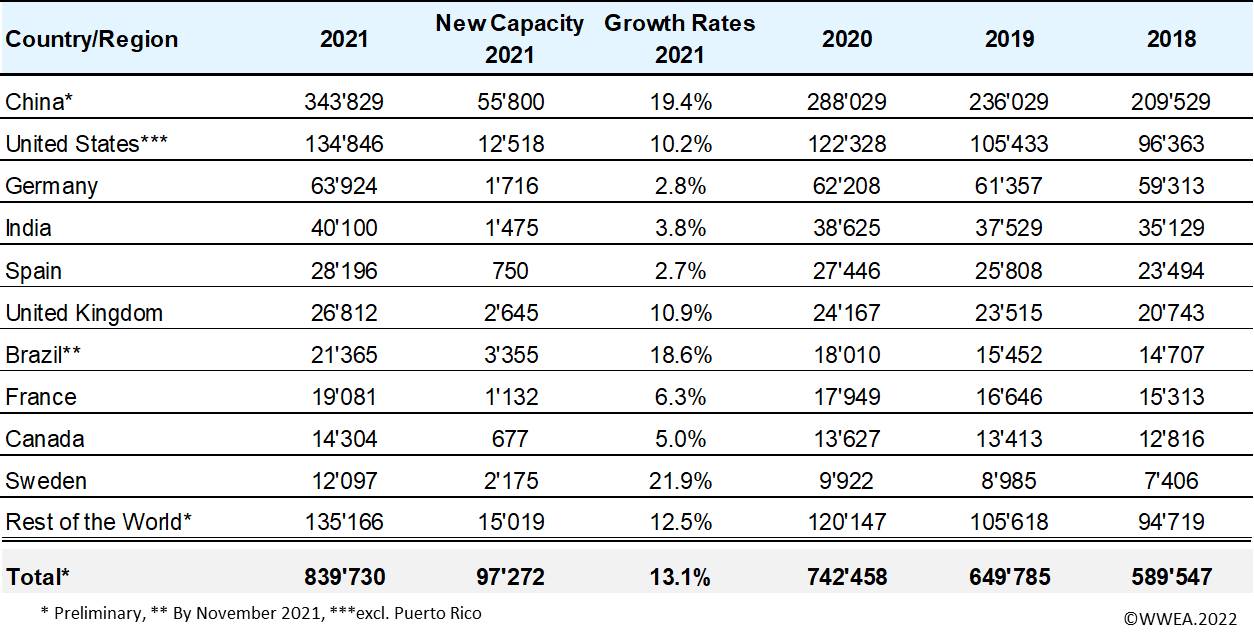
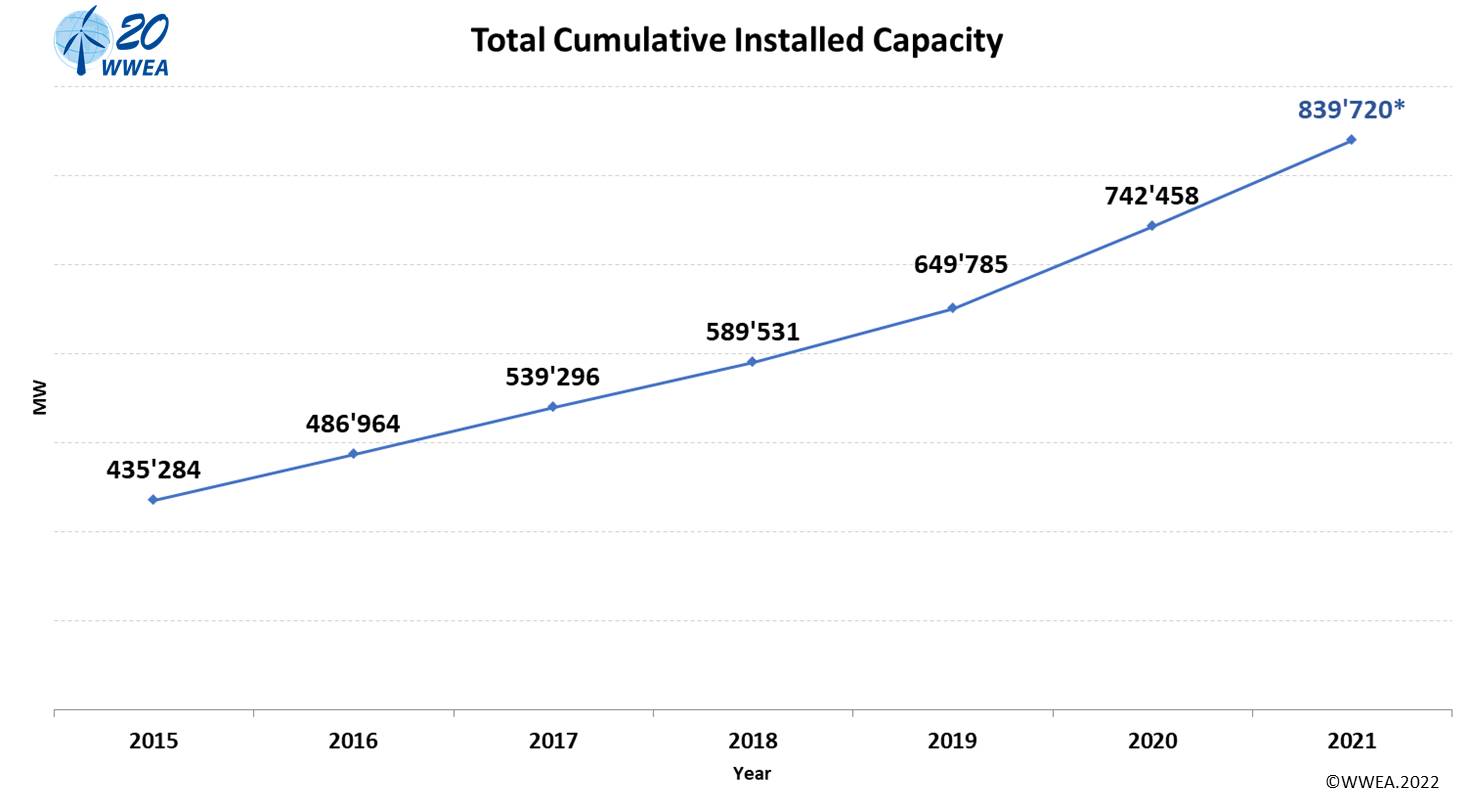
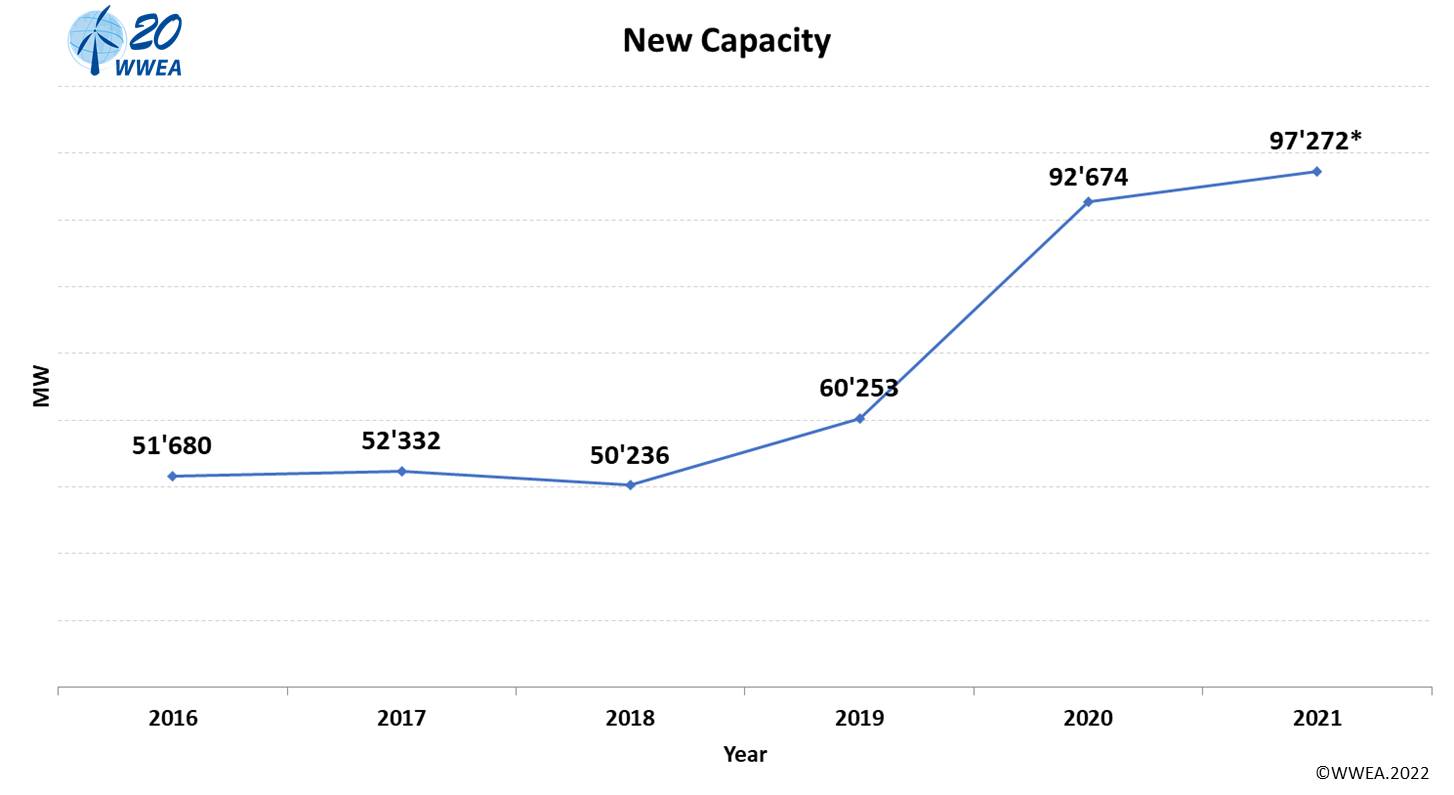
Bonn, 18 March 2022 (WWEA) – According to preliminary statistics published by WWEA today, the world market for wind turbines reached another record in 2021 with wind turbines with a total capacity of 97,5 Gigawatt installed around the globe, after 92,7 Gigawatt in 2020. The overall capacity of all wind turbines worldwide has now exceeded 840 Gigawatt (after 742,5 Gigawatt in 2020), enough to provide more than 7% of the global power demand.
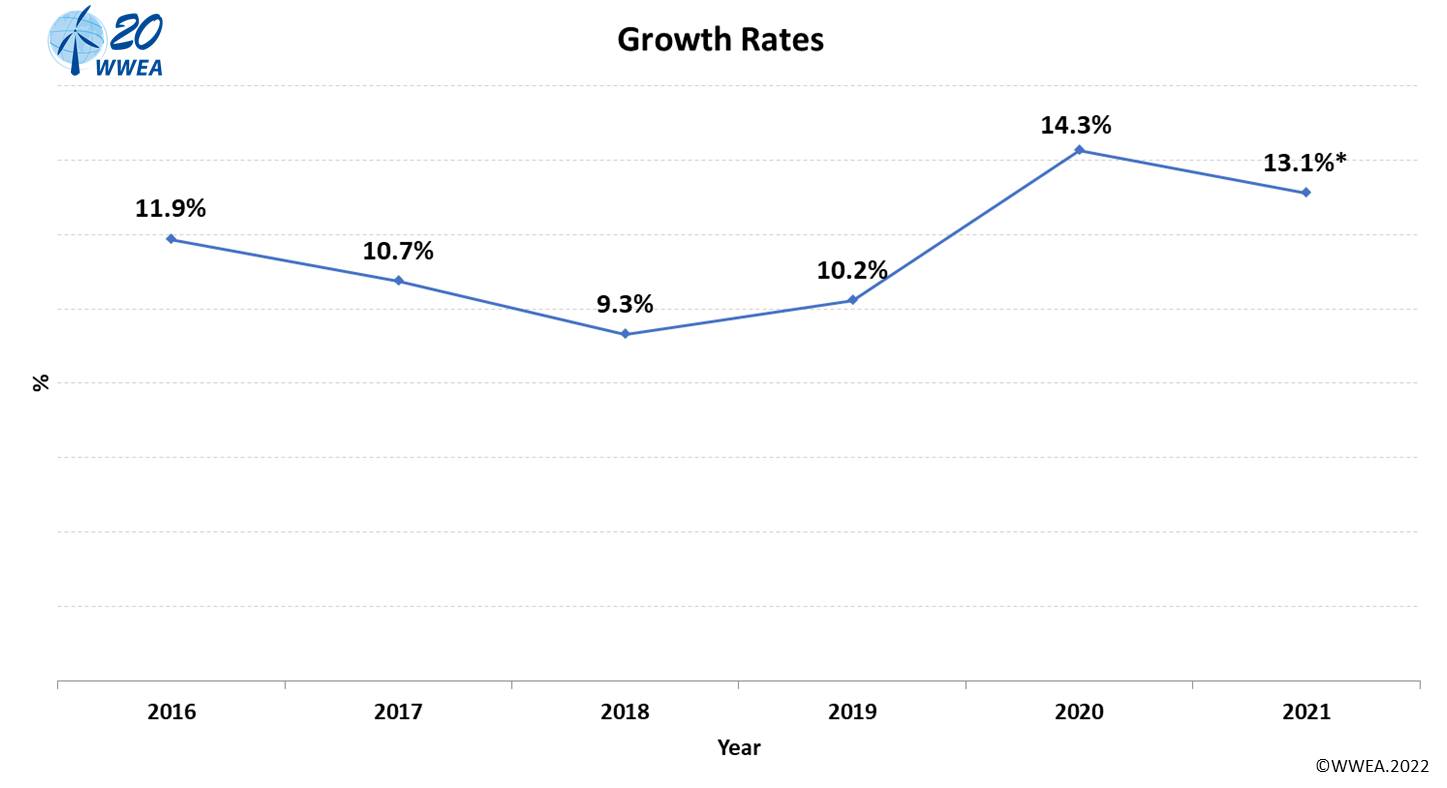
This equals a growth rate of 13%, compared to 14% one year earlier and 10% in 2019.
According to preliminary figures from China, the country alone installed 55,8 Gigawatt in 2021, once again beating its own record of 2020 when 52 Gigawatt were installed. This is equivalent to a growth of 19,4%. China has now 344 Gigawatt of wind turbines installed across the country.
The US as the world’s number 2 market saw robust growth of 12,5 Gigawatt, although substantially less than in 2020 when almost 17 Gigawatt were added. The installed wind power capacity in the US is now close to 135 Gigawatt.
Brazil has turned out as the world’s third largest market for new wind turbines and showed 18,6% growth, adding 3,4 Gigawatt in one year. This makes the country the undisputed wind power leader in South America, with an overall wind power capacity of 21,4 Gigawatt.
The European markets show diverse developments: While the United Kingdom (2,6 Gigawatt) and Sweden (2,2 Gigawatt) achieved new installations of more than 2 Gigawatt and Germany slightly improved with 1,7 Gigawatt of net additions, although still far below 2017/2018, several European markets underperformed in 2021. Sweden entered the top ten wind markets as newcomer, with now 12 Gigawatt of overall wind capacity.
The second largest Asian wind power nation, India, reached a milestone of over 40 Gigawatt of total capacity, however, the country is behind its targets and added around 1,5 Gigawatt in the calendar year 2021. Ambitious national targets for wind power indicate that strong growth can be expected in the near future.
“Wind energy has continued to maintain major growth rates around the world.“ Peter Rae, President of World Wind Energy Association, said today. “The first publication of the 2021 wind industry Annual Statistics now being released by WWEA, show strong leadership in new installations by China followed in growth percentage by Brazil. Brazil’s outstanding growth has followed predictions made during the holding of our World Wind Energy Conference WWEC2019 in Rio de Janeiro.“ Mr Rae said congratulating Dr. Everaldo Feitosa, the Brazil Honorary Vice President of WWEA.
“The world needs pollution free clean energy supply and the wind industry continues to play a very strong role in achieving this growth notwithstanding the trade and general economic disruptions caused by the Covid 19 pandemic.“ Mr. Rae said. “China has maintained its leadership in new wind turbine deployment. This has included substantial development of offshore siting of wind farms as well as huge new land based wind. The Chinese Wind Energy Association, with its Honorary Chair and President Emeritus of the WWEA, He Dexin, as well as CWEA Secretary General and WWEA Vice President Qin Haiyan, continues to provide drive and assistance in that growth as does China’s leading manufacturer Goldwind with Wu Gang, its business head and former WWEA Vice President.”
WWEA Secretary General Stefan Gsänger: “The new record shows us what the wind industry is capable of achieving, even in pandemic times. The world is on its way to the age of renewables, and this development is even expected to be accelerated by the ongoing war in Ukraine. Governments and people around the world are shifting towards locally resourced, affordable renewable energy which ensures energy independence and peace.”
Country/Region
2025
New Capacity 2025
Growth Rates 2025
2024
2023
2022
China
691'750
130'258
23.2%
561'492
474'600
395'230
United States
160'881
6'272
4.1%
154'609
150'455
144'053
Germany
77'285
4'602
6.3%
72'683
69'475
66'242
India
54'500
6'300
13.1%
48'200
44'736
41'600
Brazil
35'886
2'244
6.7%
33'642
28'580
23'661
Spain
33'260
1'062
3.3%
32'198
30'797
30'158
United Kingdom
33'080
998
3.1%
32'082
30'036
28'683
France
26'117
1'429
5.8%
24'688
23'474
20'915
Canada
19'500
1'065
5.8%
18'435
16'986
15'212
Sweden
18'045
1'037
6.1%
17'008
16'251
14'278
Rest of the World
196'612
14'485
8.0%
182'127
166'400
150'761
Total
1'346'916
169'752
14.4%
1'177'164
1'051'790
930'793
Country/Region
2025
New Capacity 2025
Growth Rates 2025
2024
2023
2022
China
691'750
130'258
23.2%
561'492
474'600
395'230
United States
160'881
6'272
4.1%
154'609
150'455
144'053
Germany
77'285
4'602
6.3%
72'683
69'475
66'242
India
54'500
6'300
13.1%
48'200
44'736
41'600
Brazil
35'886
2'244
6.7%
33'642
28'580
23'661
Spain
33'260
1'062
3.3%
32'198
30'797
30'158
United Kingdom
33'080
998
3.1%
32'082
30'036
28'683
France
26'117
1'429
5.8%
24'688
23'474
20'915
Canada
19'500
1'065
5.8%
18'435
16'986
15'212
Sweden
18'045
1'037
6.1%
17'008
16'251
14'278
Turkey
15'934
2'142
15.5%
13'792
11'697
11'405
Australia
15'382
94
0.6%
15'288
11'989
11'047
Italy
13'142
580
4.6%
12'562
12'012
11'647
Netherlands
11'813
122
1.0%
11'691
11'015
8'215
Poland
10'700
467
4.6%
10'233
9'383
7'950
Finland
9'330
972
11.6%
8'358
6'946
5'677
Mexico
8'670
0
0.0%
8'670
8'310
7'312
Denmark
7'510
4
0.1%
7'506
7'107
6'949
Vietnam
7'403
2'493
50.8%
4'910
4'910
3'966
Japan
6'434
594
10.2%
5'840
5'214
4'727
Chile
5'975
1'152
23.9%
4'823
4'800
3'810
Portugal
5'965
27
0.5%
5'938
5'804
5'730
Belgium
5'850
535
10.1%
5'315
5'315
5'041
Greece
5'695
341
6.4%
5'354
5'226
4'683
Norway
5'133
0
0.0%
5'133
5'130
5'105
Ireland
5'095
188
3.8%
4'907
4'713
4'527
Argentina
4'496
177
4.1%
4'319
3'705
3'309
Austria
4'221
244
6.1%
3'977
3'885
3'572
Chinese Taipei
3'905
0
0.0%
3'905
2'674
1'186
South Africa
3'763
203
5.7%
3'560
3'560
3'560
Rest of the World
40'196
4'150
11.5%
36'046
33'004
31'343
Total
1'346'916
169'752
14.4%
1'177'164
1'051'790
930'793